Supplementary Methods
Sample preparation
Each laboratory (Chalmers, IARC, and UEF) provided their own laboratory-specific pooled plasma samples, from which we prepared an additional pooled QC sample, and acquired a commercial reference plasma sample (Standard Reference Material 1950; Metabolites in Frozen Human Plasma, National Institute of Standards and Technology, Gaithersburg, MA, USA). The samples for the LC-MS analysis were prepared by following an established protocol. Briefly, cold acetonitrile and then plasma (400 µL ACN per 100 µL plasma) were added into 96-well filter plates [0.2 μm Captiva ND filter plates and Captiva collection well plates (Agilent Technologies)], and the filtering was performed by centrifuging the plates for 5 min at 700 × g at 4 °C.
LC-MS analysis
Each laboratory performed both RP and HILIC chromatography to separate the metabolites and quadrupole time-of-flight (QTOF) mass spectrometry for the measurement of the analyte ions. The detailed LC-MS conditions and settings are listed separately for RP (Supplementary Table 1) and HILIC (Supplementary Table 2). Briefly, for the RP chromatography, we used a Waters ACQUITY UPLC HSS T3 column (2.1 × 100mm, 1.8 μm) at 45 °C. The mobile phase consisted of ultrapure water and LC-MS grade methanol, both with 0.05 % (v/v) of formic acid, and the gradient was as follows: 0–6 min: 5% to 100% methanol, 6–10.5 min: 100% methanol, 10.5–13 min: 5% methanol, at 0.4 ml/min. For HILIC, we used a Waters ACQUITY UPLC BEH Amide column (2.1 × 100mm, 1.7 μm) at 45 °C. The mobile phase consisted of ultrapure water (A) and 90% (v/v) LC-MS grade acetonitrile:water (B), both containing 10 mM ammonium formate of pH 3.5, and the gradient was as follows: 0–1 min: 100% B, 1–8 min: 100% B to 70% B, 8–13 min: 100% B, at 0.4 ml/min. The injection volume was 2 μL. The pooled QC sample was also used as a quality control sample that was injected at the beginning, in the middle, and at the end of the sample sequence. For the mass spectrometry, we used Agilent QTOF instruments (varying models). The data acquisition was performed in the centroid mode with a 1.67 Hz acquisition rate. The MS/MS acquisition was performed with DDA (data-dependent acquisition) at (+/−) 10, 20, and 40 eV. Laboratory 1 used an iterative process where a second round of MS/MS spectra were acquired for features that were not selected for fragmentation in the first round; laboratories 2 and 3 used low and high mass ranges to allow more molecular features to be fragmented.
Data analysis
The raw data files were first converted into .abf files with ABF converter (version 1.3). The peak picking and alignment were performed for the dataset containing data from all three participating laboratories with MS-DIAL version 4.70. For peak picking, the minimum peak height was set to 3000, and the m/z tolerances for MS1 and MS2 were set to 0.01 and 0.025 Da, respectively. Mass slice width 0.1 and linear weighted moving average as the smoothing method, smoothing level 3 scans and minimum peak width 5 scans. The following adducts and in-source fragments were selected: [M+H]+, [M+NH4]+, [M+Na]+, [M+CH3OH+H]+, [M+K]+, [M+ACN+H]+, [M+H−H2O]+, [M+H−2H2O]+, [2M+H]+ and [M−NH4+H]+ in the positive mode and [M−H]−, [M−H2O−H]−, [M+Cl]−, [M+FA−H]−, [2M−H]− in the negative mode.
The inclusion criteria for the signals to be considered as robustly detected were based on conventions in the field to have a) sample-to-blank ratio (average:average of the peak areas) greater than 3 in data from at least two laboratories and b) both relative standard deviation (RSD) of intensity < 30% and signal-to-noise ratio of the chromatographic peaks (S/N) > 5 in at least 7 out of 15 of the five sample type–laboratory combinations (pooled plasma, laboratory-specific pooled plasma, and NIST1950 plasma analysed in three laboratories). The impact of the sample type–laboratory combination criteria on the number of detected robust molecular features was assessed (Supplementary Figure 1) and no clear cut-off value (i.e., a plateau in the graph) could be determined. Putatively identified metabolites that initially did not fulfil these criteria were considered robustly detected if the criteria were met after the manual curation of peak shape and alignment. Since many chemical compounds present in a typical solvent background, such as plasticizers, are part of the exposome, we used a sample-to-blank intensity ratio (average:average) of 3 as a minimum requirement for the signal to be considered as originating from the samples and thus considered as a true metabolite.
The identification of the metabolites was performed in MS-DIAL against an in-house database consisting of 602 standards previously analyzed with at least one of the participating laboratories and publicly available LC-MS spectral databases. Additional identification of the lipids was carried out using the lipidomics workflow in MS-DIAL, which utilizes an enriched LipidBlast (version 67) in silico library. The metabolite identification was carried out by two independent scientists. The most likely molecular formulas were calculated based on the exact mass, isotopic peak distribution, and existing database structures in MS-FINDER version 3.52. For the Formula finder function in MS-FINDER, we chose the following parameters: LEWIS and SENIOR check, isotopic ration tolerance of 20%, element probability check, and O, N, P, and S as elements (in addition to C and H). Molecular features for which no formula could be calculated were excluded based on their high likelihood to not originate from typical adducts of biomolecules. We classified the identified metabolites into nine superclasses based on their biochemical properties: organonitrogen compounds, amino acids and derivatives, benzenoids, other organic acids, other semi-polar metabolites, steroids and bile acids, fatty acids and derivatives, phospholipids, and other lipids.
Based on information available in the Human Metabolome Database (HMDB), we classified the identified metabolites based on their source: 191 compounds are endogenous human metabolites, whereas 86 metabolites originate from dietary sources, 17 metabolites are commonly produced by microbiota, and 14 metabolites are considered to be part of the human exposome.
Supplementary Table 1. The HPLC and MS parameters used for the reversed-phase (RP) separation.
| Laboratory 1 | Laboratory 2 | Laboratory 3 | |
|---|---|---|---|
| HiP Sampler | |||
| Model | G7167B | G4226A | G4226A |
| Injection volume, µL | 2 (4 in RP−) | 2 | 2 |
| Tray temperature, °C | 10 | 4 | 10 |
| Draw + eject speed | 200 | 200 | 200 |
| Draw position offset, mm | 1 | −1.5 | 1.0 (0 in RP−) |
| Wait time after drawing | 0 | 2 | 0 |
| Vial/Well bottom sensing | yes | no | yes |
| Needle wash | Multi-wash | In flush port | In flush port |
| ADVR | no | no | no |
| Wash time | 20 | 3 | 2 |
| Enable overlapped injection | no | no | yes, @ 16 min |
| Binary Pump | |||
| Model | G7120A | G4220B | G4220A |
| Stop time, min | 13.0 | 13.0 | 13.0 |
| Gradient |
0–6 min: 5 → 100% B 6–10.5 min: 100% B 10.5–10.51 min: 100 → 5% B 10.51–13 min: 5% B |
||
| Mobile phase A | Water with 0.05% FA | Water with 0.05% FA | Water with 0.1% FA |
| Mobile phase B | MeOH with 0.05% FA | MeOH with 0.05% FA | MeOH with 0.1% FA |
| Flow rate, mL/min | 0.4 (0.6 from 10.9 min to 11.5 min) | 0.4 | 0.4 |
| Mixer volume | 35 | 100 | 35 |
| Column Thermostat | |||
| Model | G7116B | G1316C | G1316C |
| Column | Waters ACQUITY UPLC HSS T3 (2.1 × 100mm, 1.8 μm) | ||
| Temperature, °C | 45 (RP+: Right not controlled) | 45 | 50 |
| QTOF | |||
| Model | 6550A | 6550A | 6540A |
| Data | Centroid | Centroid | Centroid |
| Acquisition rate, Hz | 1.67 | 1.67 | 1.67 |
| MS threshold | 200 | 100 | 150 |
| Ion source | Dual AJS | Dual AJS | AJS |
| Divert valve | 0: MS, 10.5: waste | 0: MS, 11: waste | 0: waste, 1: MS |
| Range, m/z | 50–1700 | 50–1200 | 20–1600 |
| Gas Temperature, °C | 175 | 175 | 325 |
| Gas flow | 12 | 12 | 10 |
| Nebulizer, psi | 45 | 45 | 45 |
| Sheath gas temperature, °C | 375 (350 in RP−) | 350 | 350 |
| Sheath gas flow, mL/min | 11 | 11 | 11 |
| Capillary voltage, V | 3500 | 3500 | 3500 |
| Nozzle voltage, V | 300 | 300 | 1000 |
| Fragmentor voltage, V | 175 | 175 | 100 |
| Skimmer voltage, V | na | na | 45 |
| Octopole voltage, V | 700 (750 in RP−) | 750 | 750 |
| Ref. solution | External, flow splitted with a T-coupling. Split controlled by capillary lengths. | External, 20 uL/min | Bottle A |
| Acquisition | |||
| Software version | B.09.00 | 10.1 | B.05.01 |
Supplementary Table 2. The HPLC and MS parameters used for the hydrophilic interaction chromatography (HILIC) separation.
| Laboratory 1 | Laboratory 2 | Laboratory 3 | |
|---|---|---|---|
| HiP Sampler | |||
| Model | G7167B | G4226A | G4226A |
| Injection volume, µL | 2 | 2 | 2 |
| Tray temperature, °C | 10 | 4 | 10 |
| Draw + eject speed | 200 | 200 | 200 |
| Draw position offset, mm | 1 | −1.5 mm | 0 |
| Wait time after drawing | 0 | 2 | 0 |
| Vial/Well bottom sensing | yes | no | no |
| Needle wash | Multi-wash | In flush port | In flush port |
| ADVR | no | no | no |
| Wash time | 15 | 3 | 3 |
| Enable overlapped injection | no | no | yes@12 min |
| Binary Pump | |||
| Model | G7120A | G4220B | G4220A |
| Stop time, min | 13.0 | 13.0 | 12.5 |
| Gradient |
0–1min: 100% B 1–8min: 100 → 70% B 8–8.01 min: 70 → 100% B 8.01–13 min: 100% B |
0–1min: 100% B 1–8min: 100 → 70% B 8–8.01 min: 70 → 100% B 8.01–13min: 100% B |
0–2.5min: 100% B 2.5–10 min: 100 → 0% B 10–10.01 min: 0 → 100% B 10.01–12.5 min: 100% B |
| Mobile phase A | Water with 20mM amm. form. pH 3.5 (retesting buffer concentration) | Water with 10mM amm. form. pH 3.5 | 50% v/v ACN in water with amm. form. pH 3 (20mM) |
| Mobile phase B | 90% ACN with 20mM amm. form. pH 3.5 (retesting buffer concentration) | 90% ACN with 10mM amm. form. pH 3.5 | 90% v/v ACN in water with amm. form. pH 3 (20mM) |
| Flow rate, mL/min | 0.4 | 0.4 | 0.6 |
| Mixer volume | 35 | 100 | 35 |
| Column Thermostat | |||
| Model | G7116B | G1316C | G1316C |
| Column | Waters ACQUITY UPLC BEH Amide (2.1 × 100mm, 1.7 μm) | ||
| Temperature, °C | 45 | 45 | 45 |
| QTOF | |||
| Model | 6550A | 6550A | 6540A |
| Data | Centroid | Centroid | Centroid |
| Acquisition rate, Hz | 1.67 | 1.67 | 1.67 |
| MS threshold | 200 | 100 | 150 |
| Ion source | Dual AJS | Dual AJS | AJS |
| Divert valve | no | no | no |
| Range, m/z | 50-1600 | 50-1200 | 50-1600 |
| Gas Temperature, °C | 175 | 175 | 325 |
| Gas flow | 12 | 12 | 10 |
| Nebulizer, psi | 45 | 30 | 45 |
| Sheath gas temperature, °C | 375 | 250 | 350 |
| Sheath gas flow, mL/min | 11 | 12 | 11 |
| Capillary voltage, V | 3500 | 3500 | 3500 |
| Nozzle voltage, V | 300 | 300 | 1000 |
| Fragmentor | 175 | 175 | 100 |
| Skimmer | na | na | 45 |
| Octopole | 750 | 750 | 750 |
| Ref. solution | External, flow splitted with a T-coupling. Split controlled by capillary lengths. | External, 20uL/min | Bottle A |
| Acquisition | |||
| Software version | B.09.00 | 10.1 | B.05.01 |
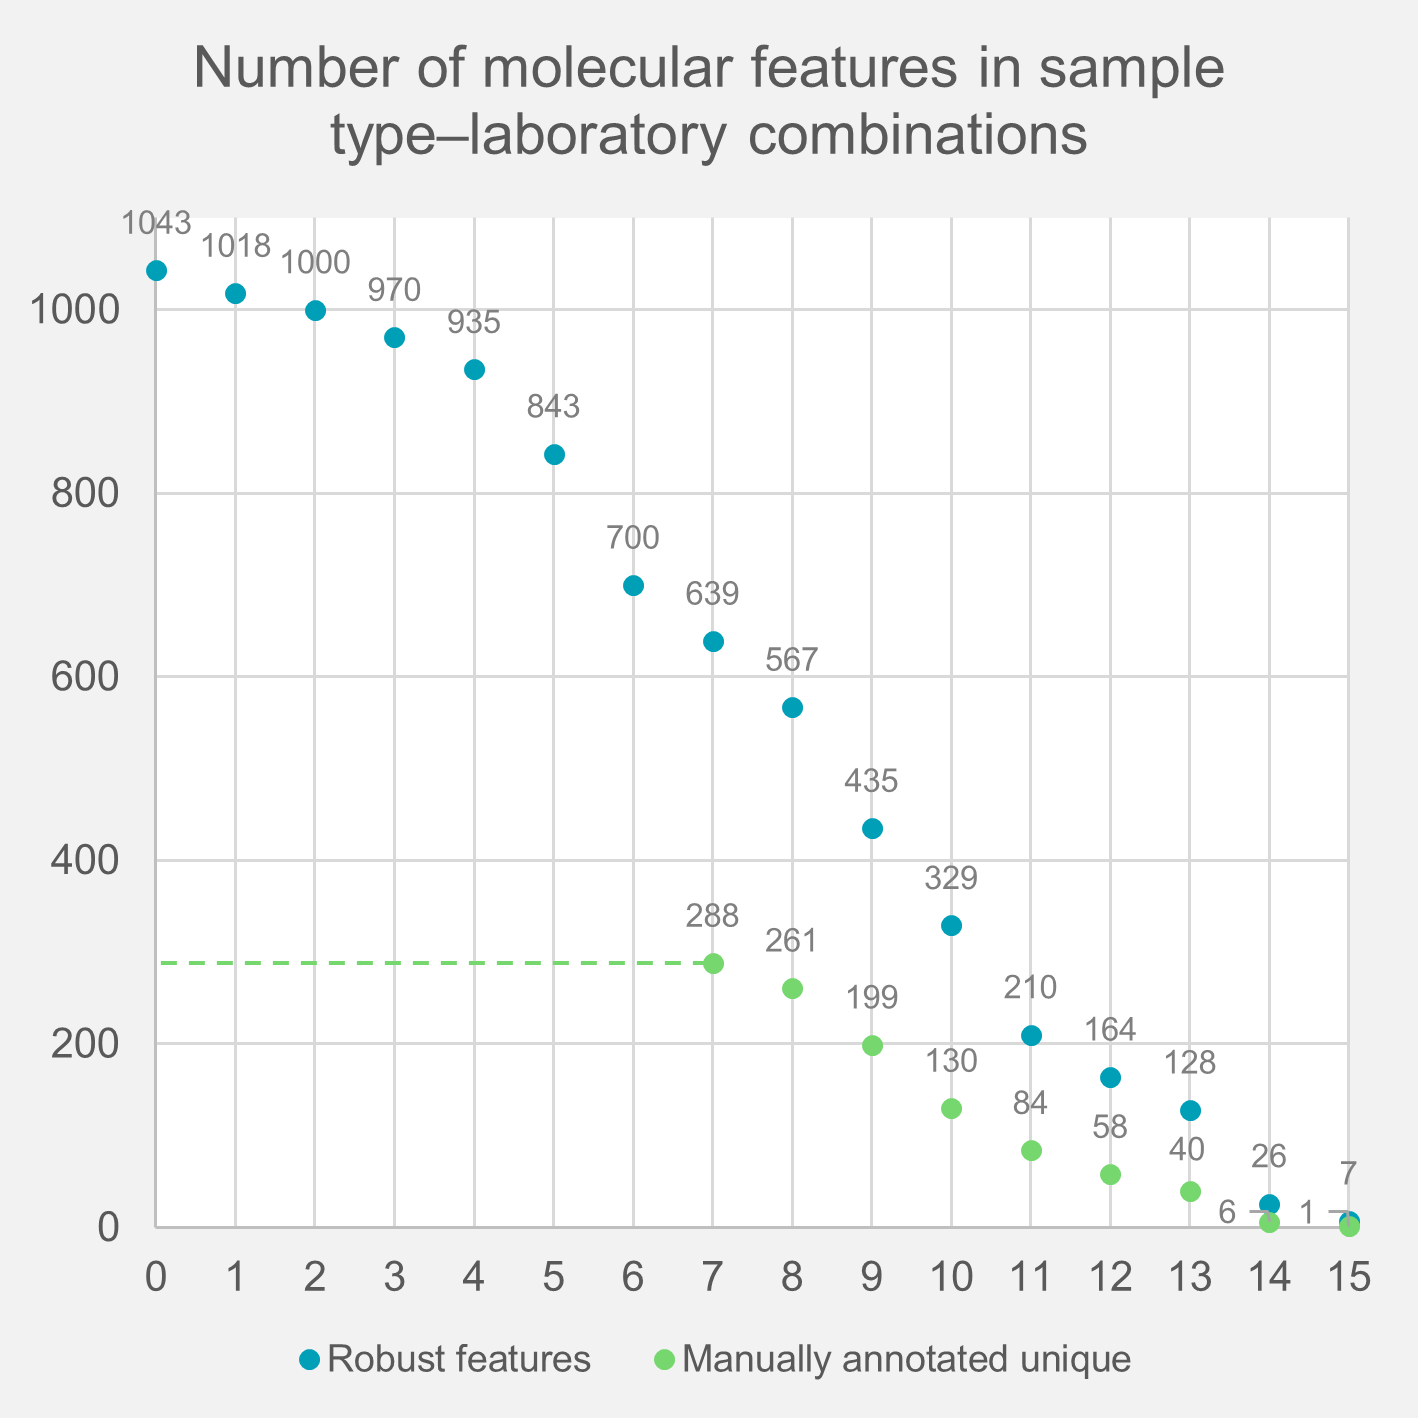
Supplementary Figure 1. The number of robustly detected molecular features and the robustly annotated unique metabolites as a function of the minimum number of sample type–laboratory combinations (out of 15) where the feature was detected. The manual annotation was performed only for molecular features detected in seven or more combinations. The other requirements, including the signal-to-noise ratio, sample-to-blank ratio, and RSD, were kept the same as described in the methods.